Building a Graphing App
For our next assignment you will be building a tablet app that can draw graphs of polynomial functions.
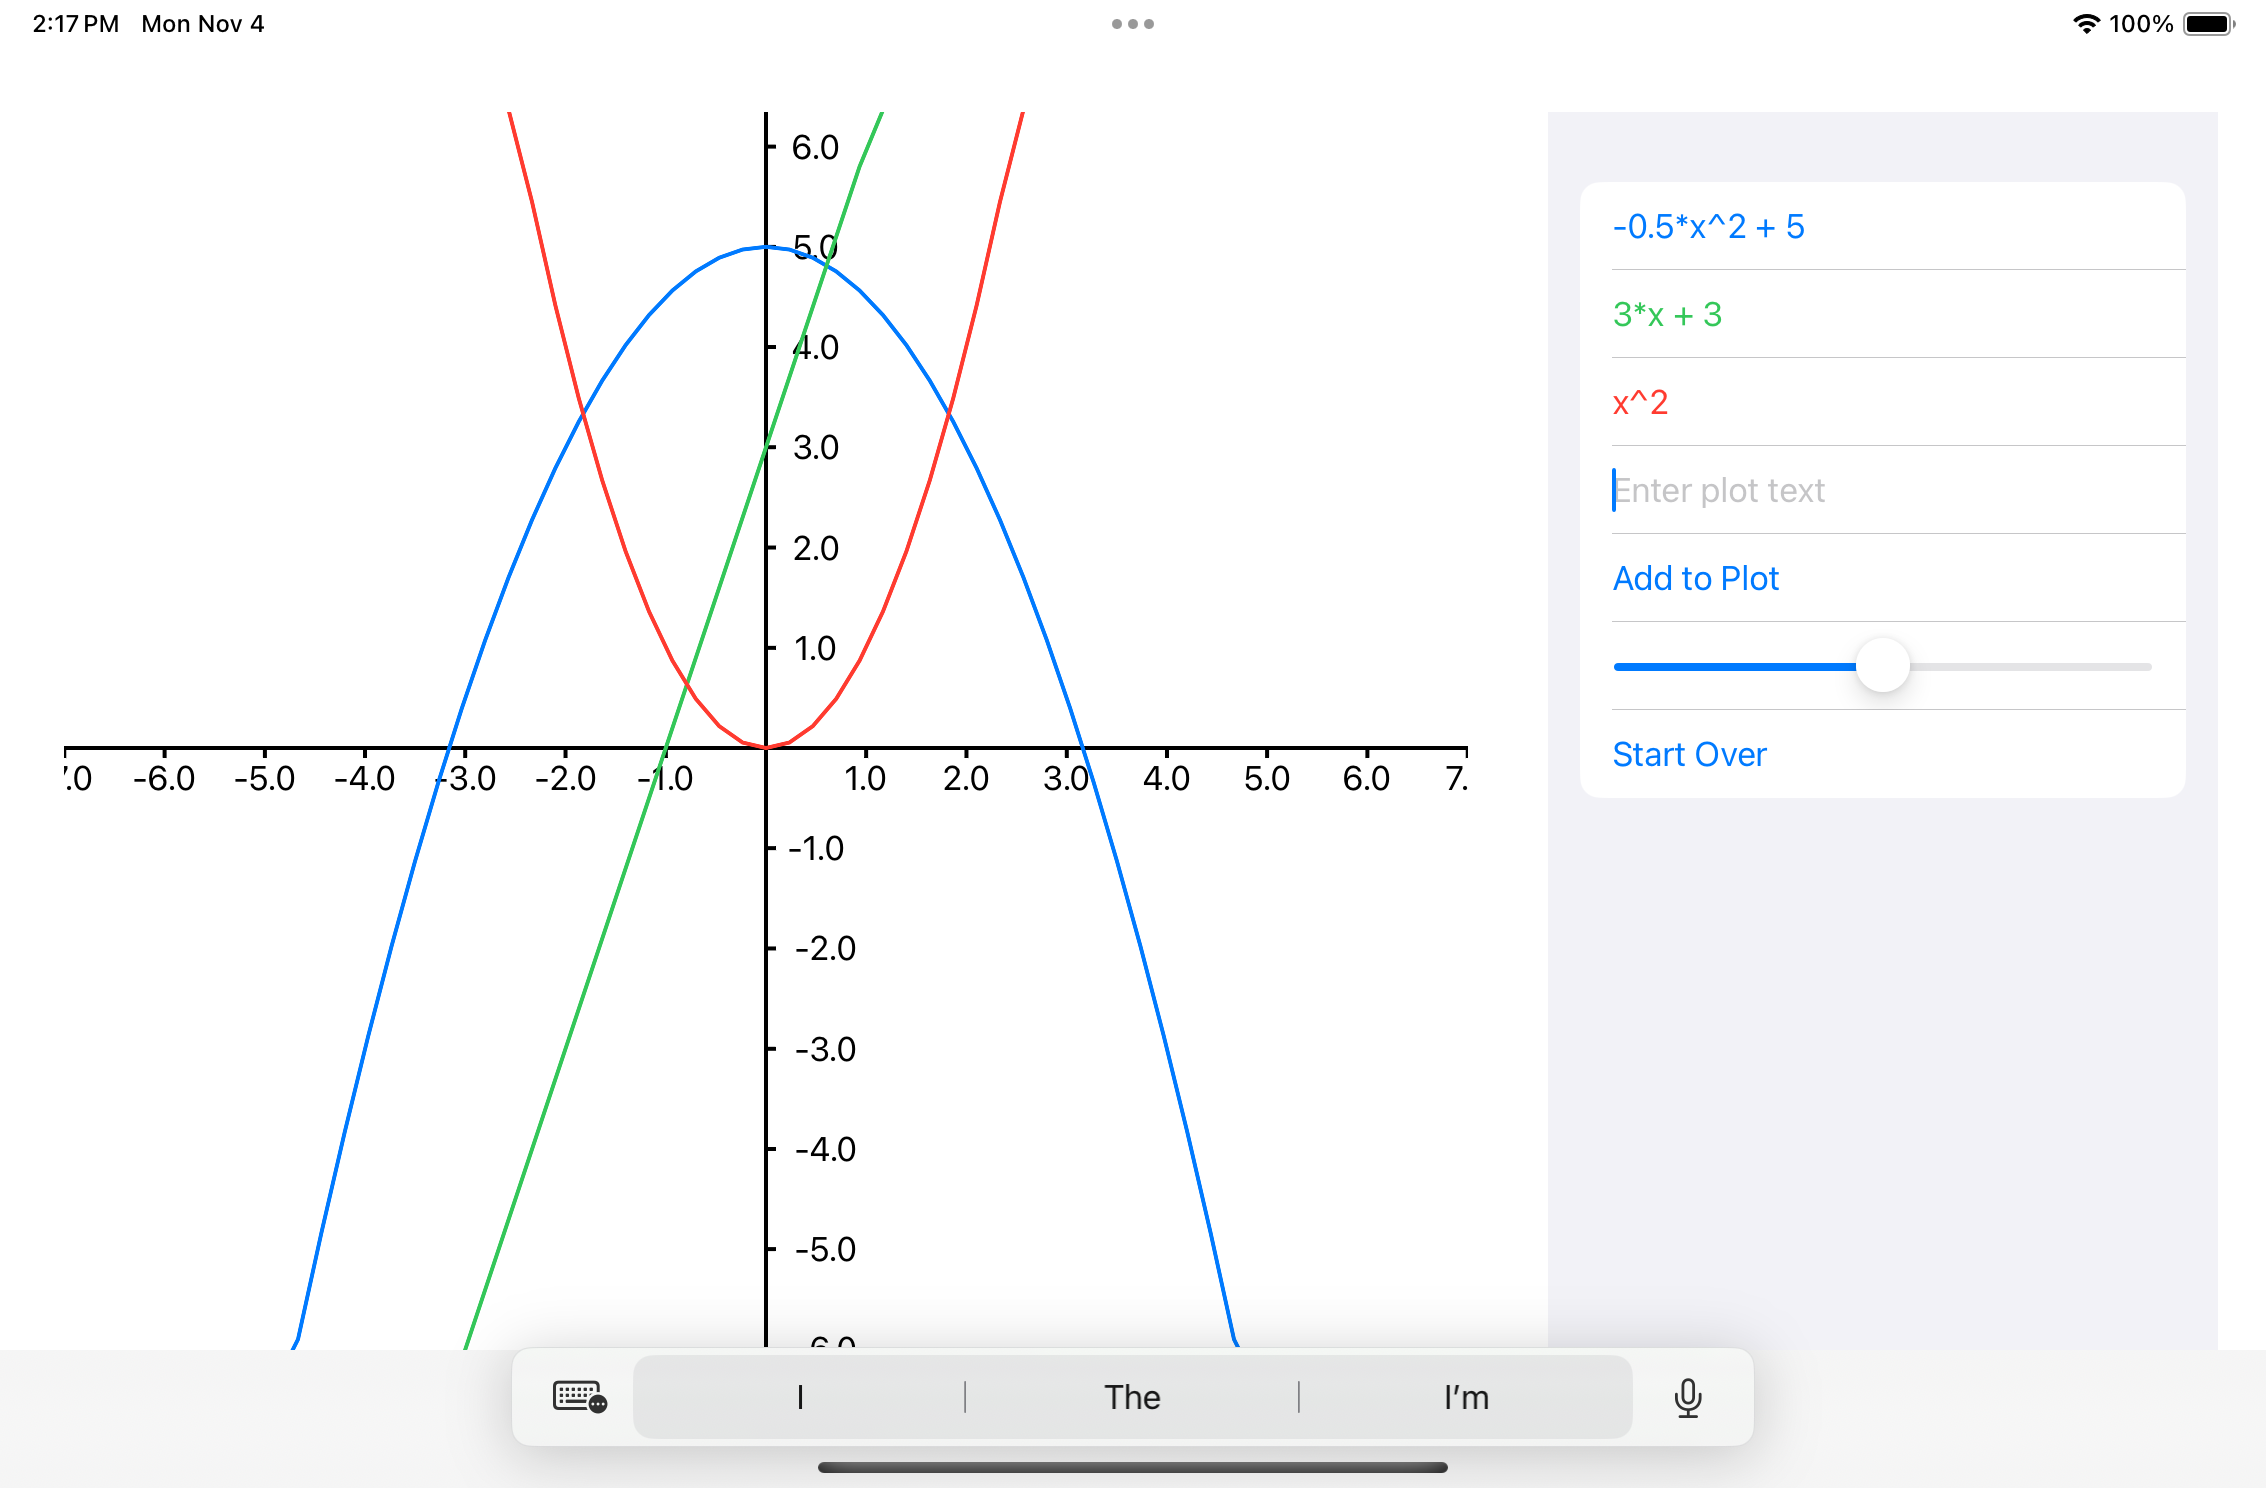
The main view will consist of two parts: a Canvas where you will draw plots of functions the user has entered, and a set of controls on the right that the user can use to add new functions to the plot and change the plot scale.
Additionally, the Canvas will respond to drag events, which will allow the user to reposition the graph on the screen.
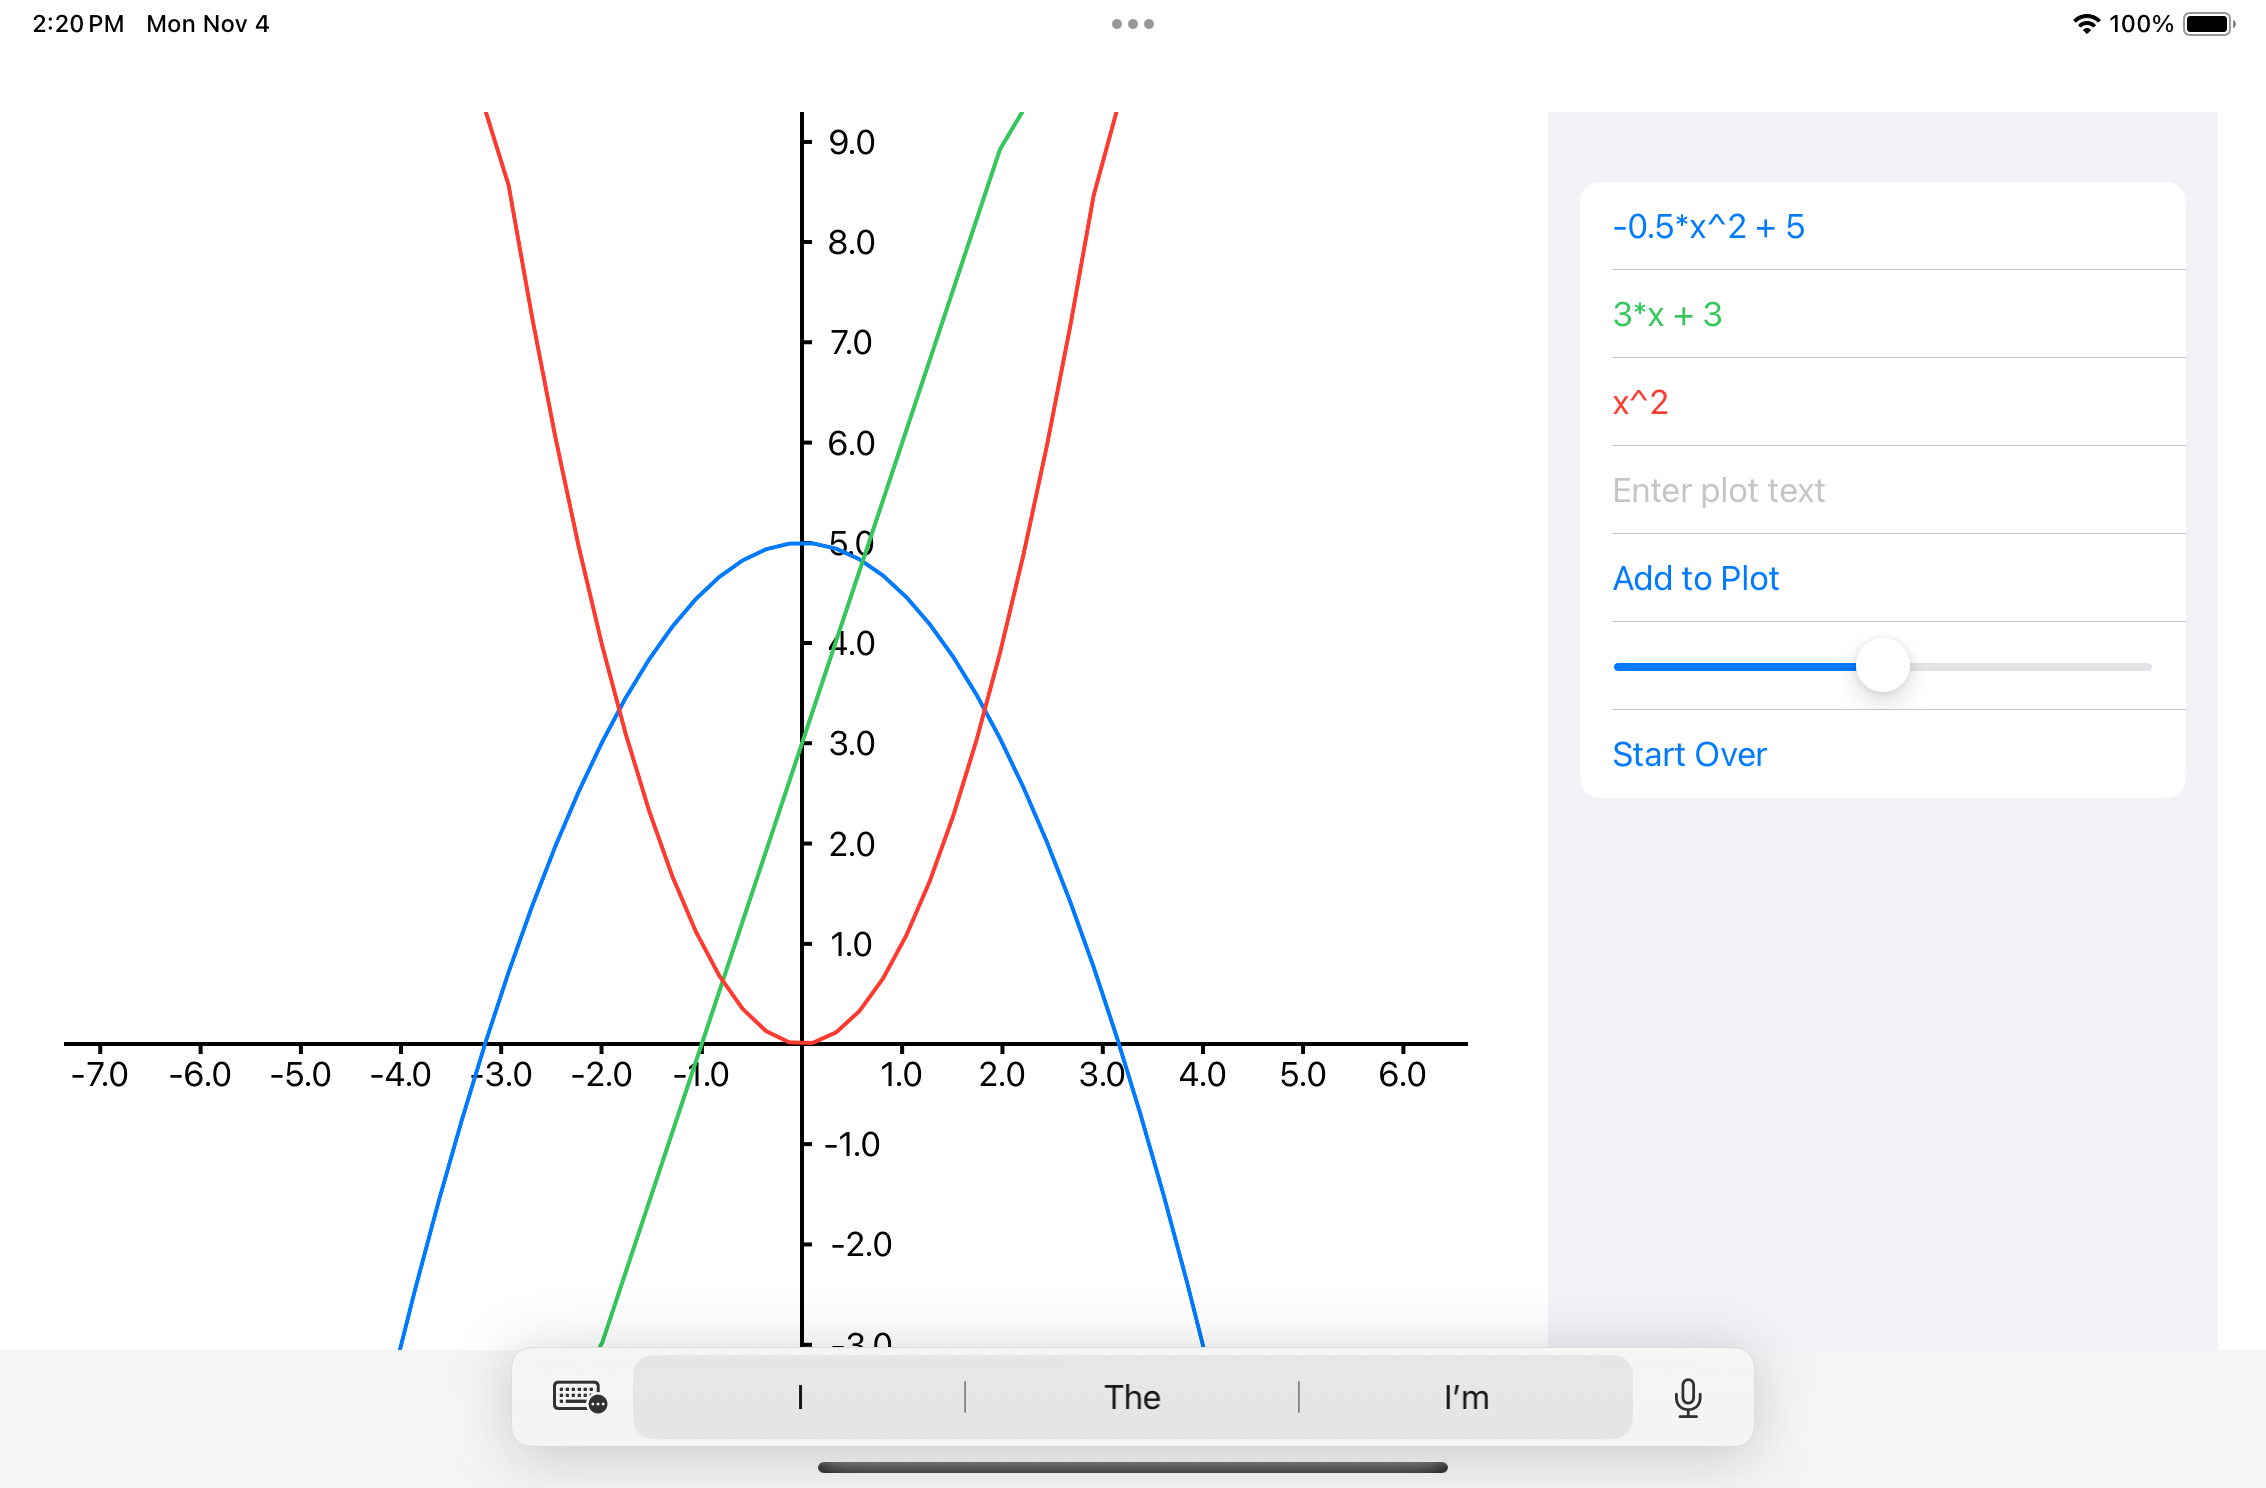
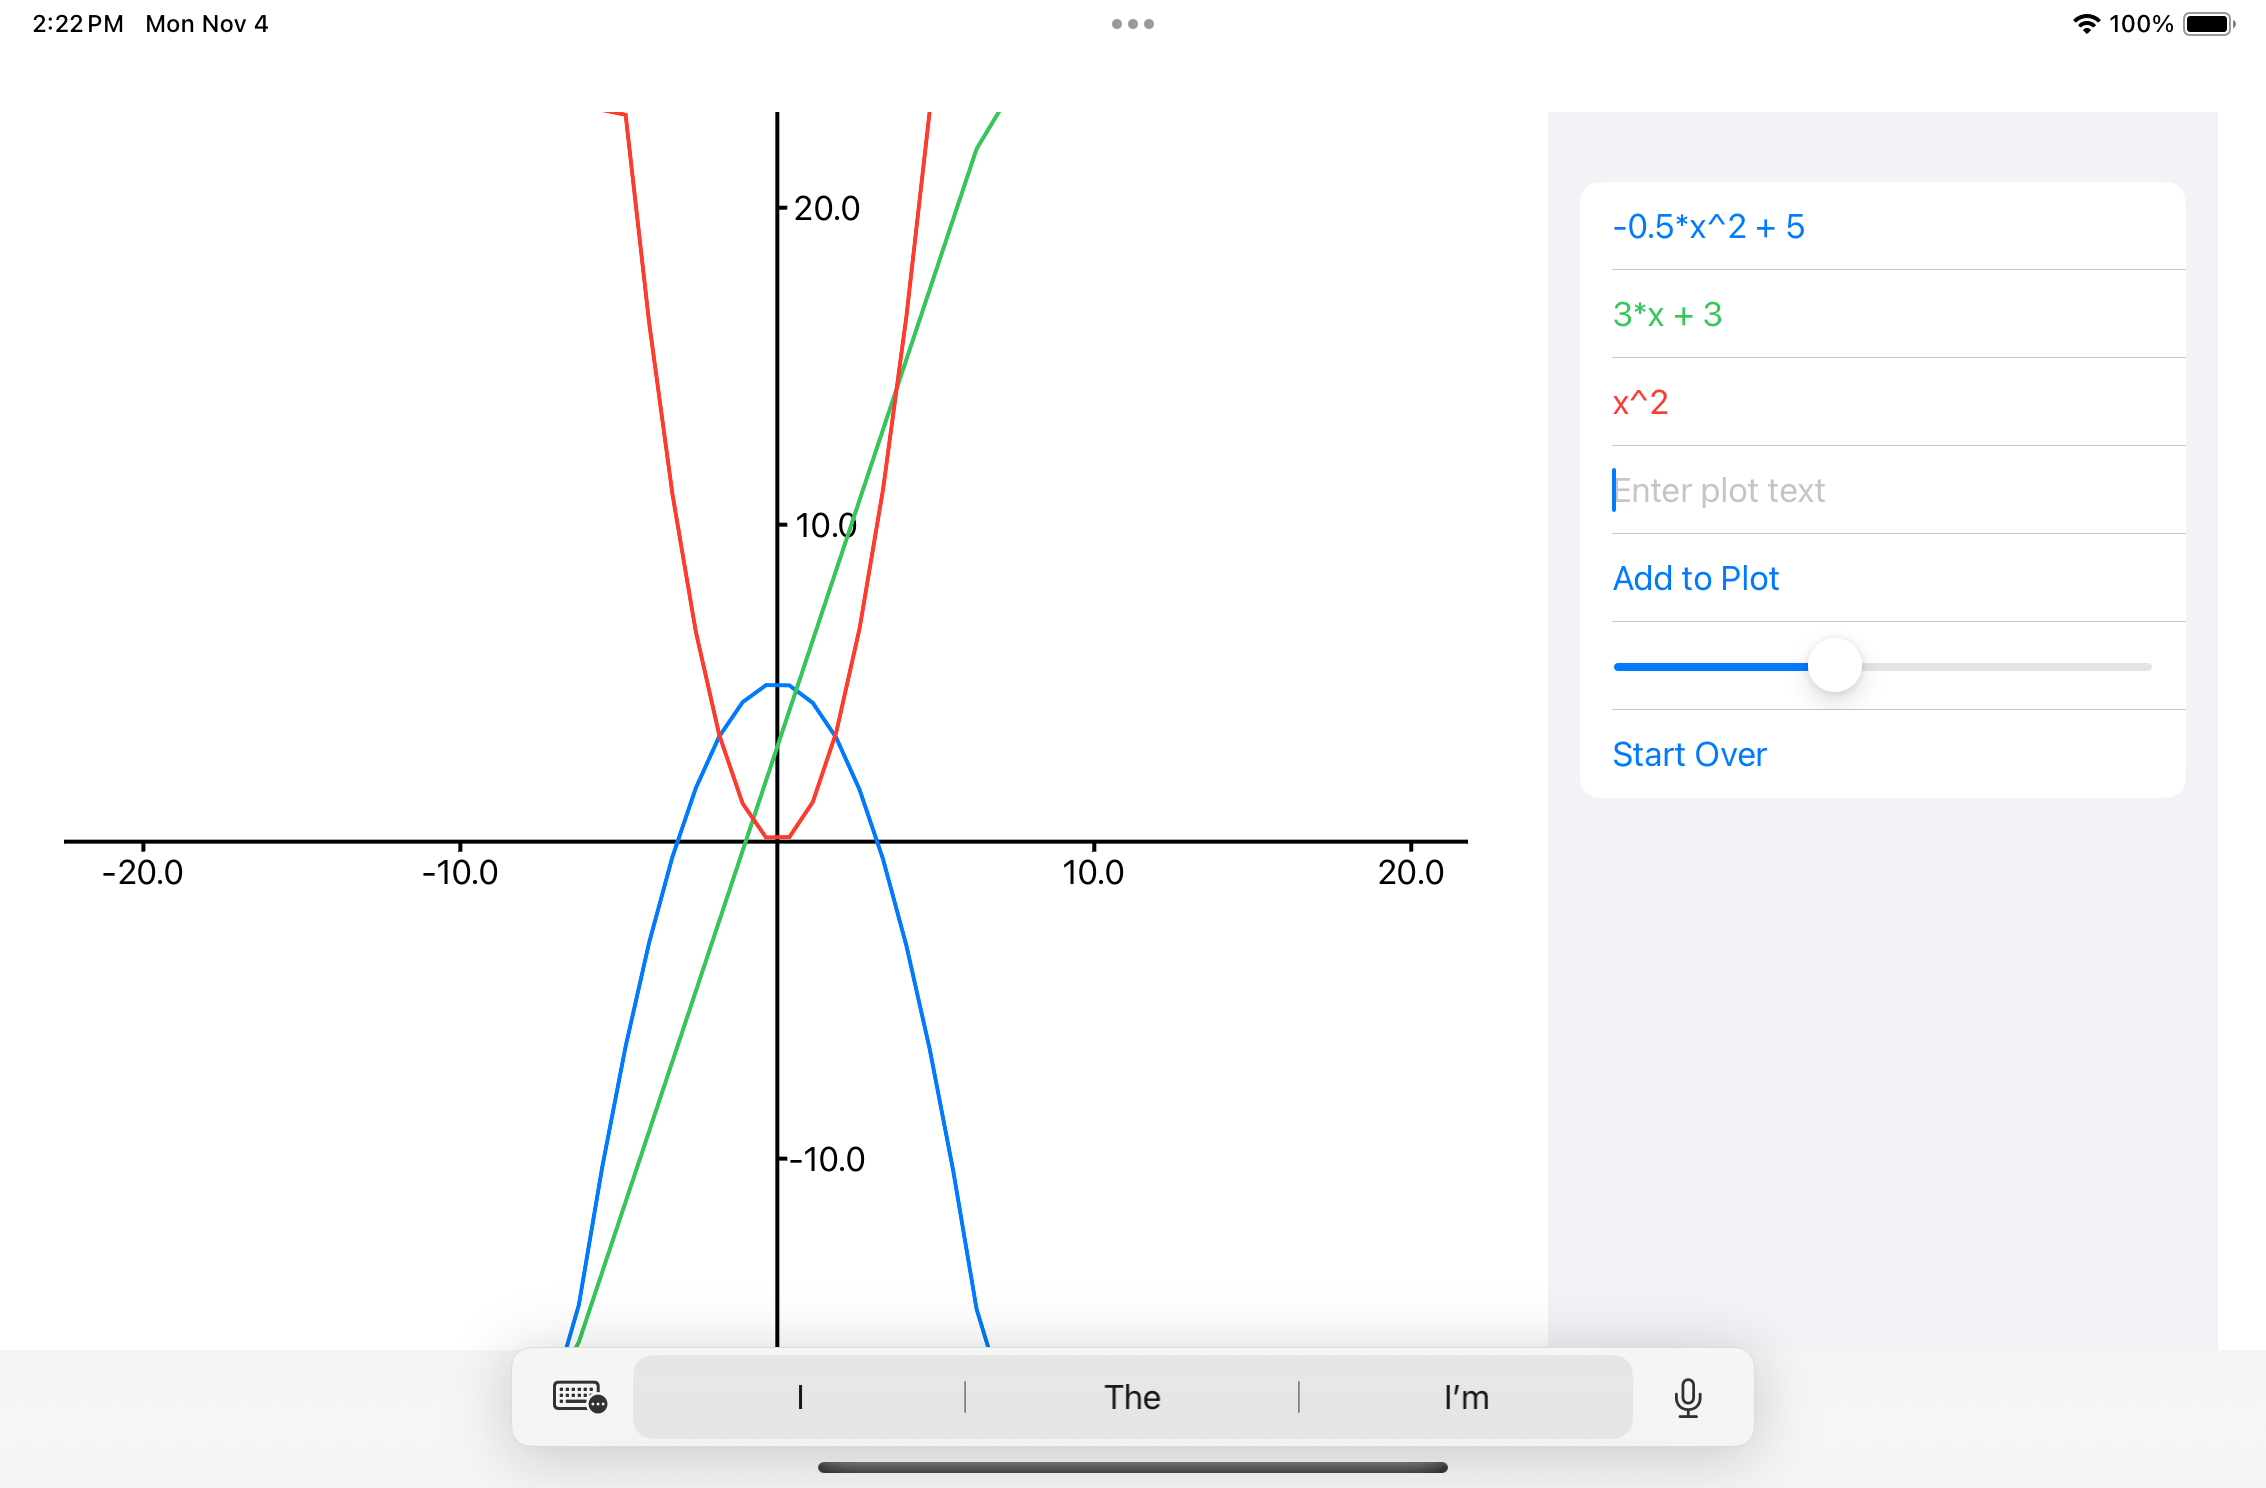
The slider on the right controls the plot scale. Moving the slider to the right zooms in on the plot, and moving the slider left zooms out.
Note also that as the user adds new functions to the plot each new function will get drawn in a different color. Note also that the list of plotted functions that appears on the top right draws the text of the functions in colors to match their plots so the user can easily see which function goes with which plot.
Working with different coordinate systems
An important aspect of this problem will be working with two distinct coordinate systems. Since you are going to be drawing your plots in a Canvas element you will have to deal with the Canvas coordinate system. At the same time you plots will have their own coordinate system with an origin initially in the center of the Canvas. To make working with these two different coordinate systems easier you should construct mapping functions that can map from one coordinate system to another. For example, given a point (x,y) in the plot coordinate system you will need to be able to convert that to a point in the Canvas coordinate system. Note that since the user can change the plot scale by moving the slider and also reposition the plot origin in the Canvas by dragging, your conversion function needs to be able to do the right thing when the user changes the scale or moves the plot around.
Some code to start with
When a user enters a description of a polynomial function in text your app will need to be able to parse that text and turn it into a data structure that represents that function. For example, if the user enters the text "-0.5*x^2+5" we will want to parse this into a tree that represents the structure of the function:
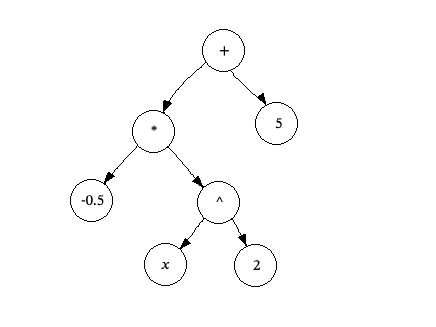
In your program this parse tree will be composed of a set of Node objects.
To construct this parse tree you will need some parsing code. Here is Swift parsing code and Kotlin parsing code
More code for iOS
To use my parsing code to parse a String variable str into a tree of nodes just do
let p = Parser(str:str)
let root = p.parse()
Once you have a pointer to the root node of the tree that represents a function, you can use the evalAt() function to compute y values from this function. For example, to compute the y value for our function at x = 2.3 we would do
let x = 2.3
let y = root.evalAt(x)
To make a plot of a function you will create an array of x values at which you want to sample the function, then build a list of y values to go with those x values. You should then convert those lists of plot coordinates into a list pt of CGPoint objects in Canvas coordinates. To plot the function you will then construct a Path object that goes through all of the points you have generated. That looks something like this:
let path = Path() { path in
    path.move(to: pts[0])
    for n in 1..<pts.count {
        path.addLine(to: pts[n])
    }
}
context.stroke(path,with:.color(plot.color),lineWidth:2)
Another problem you will have to solve is getting the top level view in our app to split into two columns with the plot on the left and the controls on the right. Here is what I did in my solution to get that arrangement:
GeometryReader { proxy in
    HStack {
        PlotView(plots:plots,scale:scale).frame(width: 2*proxy.size.width/3)
        OptionsView(plots:$plots,scale:$scale).frame(width: proxy.size.width/3)
    }
}.padding()
The GeometryReader component can provide you with information about the size of the area a view has to work with. Here I have used that information to assign 2/3 of the available width to the plot and the remaining 1/3 to the view that displays the controls for the plot.
More code for Android
To use my parsing code to parse a String variable str into a tree of nodes just do
val p = Parser(str=str)
val root = p.parse()
Once you have a pointer to the root node of the tree that represents a function, you can use the evalAt() function to compute y values from this function. For example, to compute the y value for our function at x = 2.3 we would do
val x = 2.3
val y = root.evalAt(x)
To make a plot of a function you will create an array of x values at which you want to sample the function, then build a list of y values to go with those x values. You should then convert those lists of plot coordinates into Canvas coordinates. To plot the function you will then construct a Path object that goes through all of the points you have generated. That looks something like this:
val path = Path()
path.moveTo(xs[0])
for(n in 1 until pts.count) {
  path.lineTo(xs[n],ys[n])
}
path.close()
scope.drawPath(path, plot.color, style = Stroke(width = 3f))
Another problem you will have to solve is getting the top level view in our app to split into two columns with the plot on the left and the controls on the right. You will be displaying these two subviews in a Row. The trick to getting the plot view to take up 2/3 of the available width in the row while the options view takes up the remaining 1/3 is to pass these two views weight modifiers. You pass Modifier.weight(2f) to the plot view and Modifier.weight(1f) to the other view.